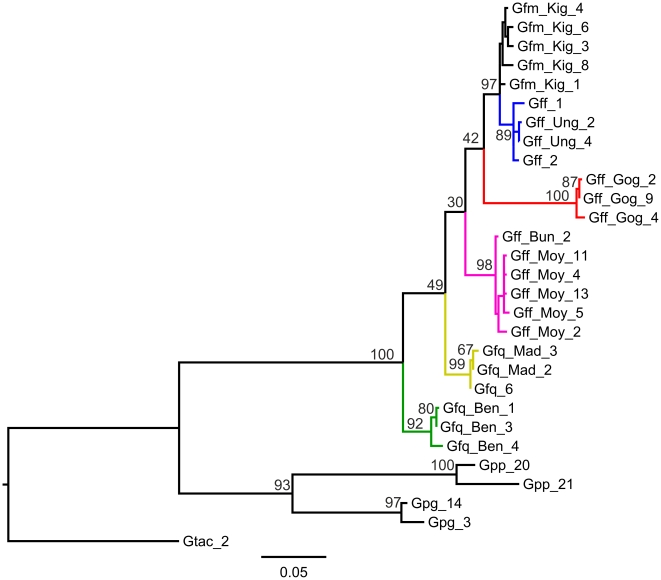
Figure 2. Maximum likelihood tree for mitochondrial genes (COI+ND2).
Distances were calculated using the Tamura Nei (1993) substitution model. Node support is given as a percentage of bootstrap replicates (n = 1000). Branch colour reflects sample collection location; blue: Lake Victoria Basin; black: G. f. martinii from Tanzania; red: Ethiopia; pink: Mid/Northern Uganda; yellow: west DRC; green: Bena Tshibangu. The tree is rooted using specimens from three species within the palpalis group; Gpp: Glossina palpalis palpalis; Gpg: Glossina palpalis gambiensis and Gtac: Glossina tachnioides. See table S1 for key to specimen names.

