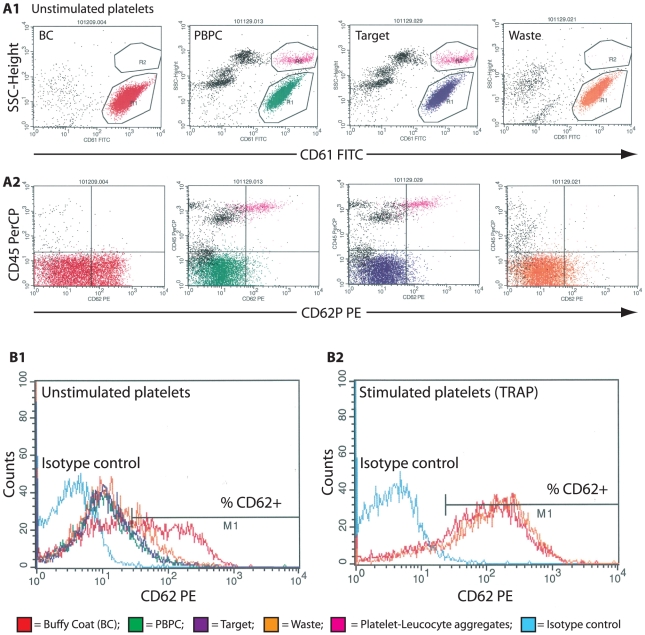
Figure 4. Platelet activation.
Analysis of platelet activation is based on the surface expression of P-selectin (CD62P). Representative dot plots and histograms from one of five samples are shown. A1) The CD61+, single platelets were gated on low side scatter properties (R1). A2) The cells were displayed and plotted against anti-CD62P and anti-CD45 to determine the relative number of activated single platelets (CD61+/CD62P+) and to confirm the exclusion of platelet-leukocyte aggregates. (R2; CD61+/CD62P+/CD45+), respectively. B) The relative number of CD62P+ platelets in the single platelet fraction (R1) was calculated for each sample by setting the M1 marker in the isotype control histogram (turquoise line). Unstimulated platelets from buffy coat platelet concentrates (BC, red line), the PBPC samples (green line), the waste fractions (orange line) and from the target fractions (dark blue line) were analysed (B1). Platelets from the waste fraction and from BC were analysed again after stimulation with TRAP (B2).

