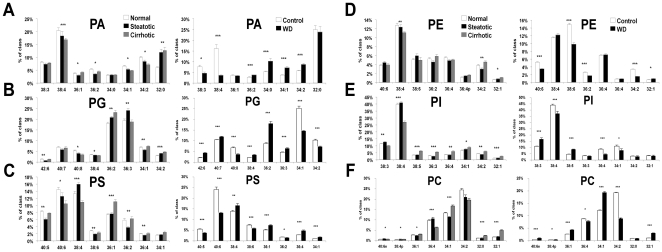
Figure 2. Selected glycerophospholipid species distribution from human and murine livers. (A, B, C, D, E, F).
Data from humans (represented in graphs on left side of lettered panels)(black bars: normal; open: steatotic; hatched: cirrhotic) for phosphatidic acid (PA), phosphatidylglycerol (PG), phosphatidylserine (PS) classes, respectively; n = 5–9 individuals per group. Graphs on right side of each panel demonstrate results in mouse model (black bars: control; open: WD); n = 3 individual mice per group. Error bars = sem. Asterisks indicate Bonferroni adjusted significance at better than the *p<0.05, **p<0.01, ***p<0.001 levels from ANOVA across disease states for human data and from Student's t test for murine data.

