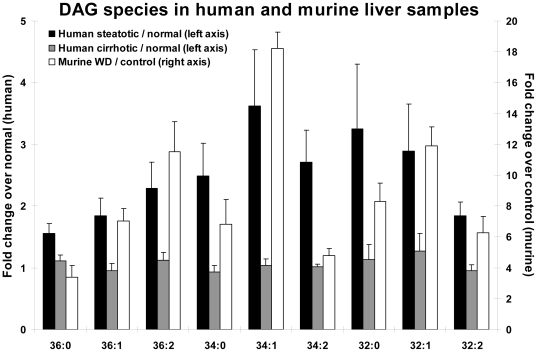
Figure 5. Fold changes in diacylglycerol (DAG) species from human and murine samples.
Comparison between DAG fold changes in mouse and human liver samples (black bars: human steatotic/normal; gray bars: human cirrhotic/normal; white bars: murine WD/control). All fold changes for WD/control and steatotic/normal are significant with p<0.0105; none of the fold changes for cirrhotic/normal are significant at p<0.05.

