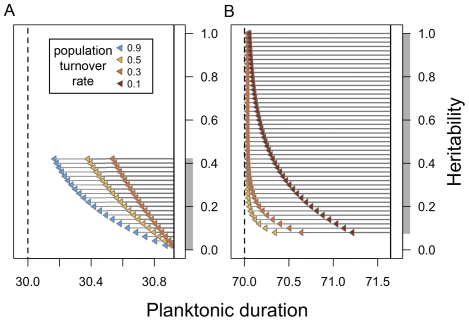
Figure 3. Summary of simulated evolution over 50 years, using different underlying heritabilities and population turnover rates.
Solid vertical lines indicate the estimated mean planktonic duration at elevated CO2, and dashed vertical lines indicate mean planktonic duration at ambient CO2, or the ‘target’ of selection, for (A) M. trossulus and (B) S. franciscanus. Grey shading along the y-axis shows the range of possible heritabilities given maternal-effect heritability of 0 to 100%. Arrowheads indicate the mean phenotype after 50 years of evolution, and arrow lengths indicate the change in mean phenotype from the initial mean phenotype towards the target of selection. Population turnover rates used in simulations are shown in colour. Higher turnover rates are shown for M. trossulus (0.3–0.9) compared to S. franciscanus (0.1–0.5) to reflect known differences in species' demography (see methods).

