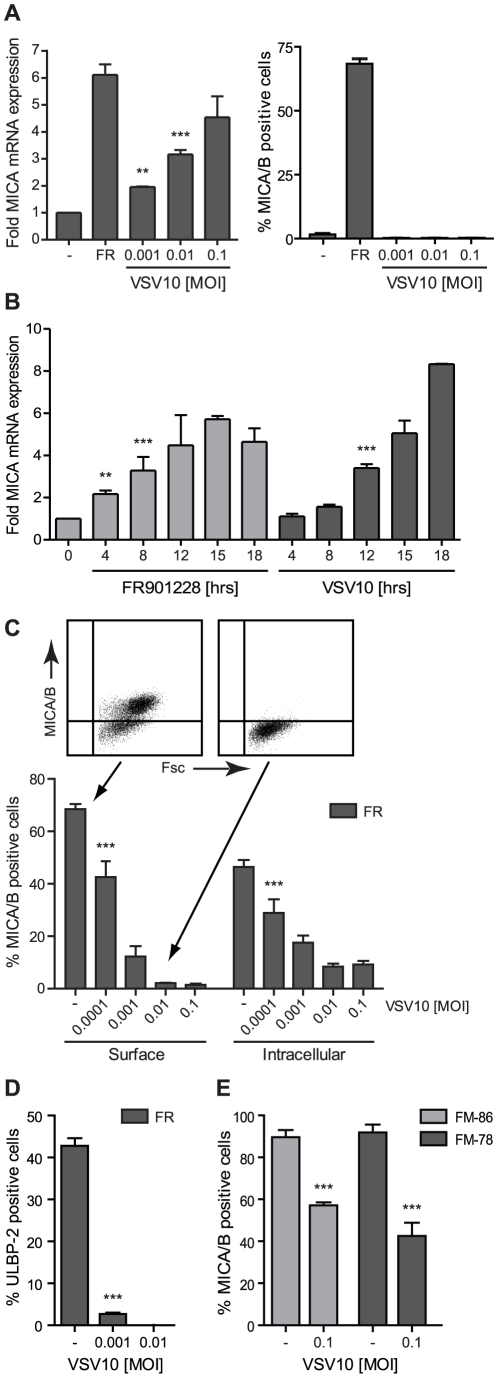
Figure 1. Surface expression of NKG2D ligands is down modulated upon VSV infection.
A, JE6-1 cells were either mock infected+non-treated with FR901228 (-), mock infected+treated with 20 ng/ml FR901228 for 18 hr (FR) or infected with the indicated MOI of VSV10 for 19 hr. The MICA mRNA level was examined by real-time RT-PCR and surface expression of MICA/B by flow cytometry. The MICA mRNA level is displayed as fold expression relative to the mock infected sample. The bar graphs show mean±SD from four experiments. B, JE6-1 cells were either treated with 20 ng/ml FR901228 or infected with 0.1 MOI VSV10 for 0, 4, 8, 12, 15 or 18 hr. The MICA mRNA level was examined by real-time RT-PCR. The MICA mRNA level is displayed as fold expression relative to the mock treated/infected sample. The bar graphs show mean±SD from two experiments. C and D, JE6-1 cells were mock infected (-) or infected with the indicated MOI of VSV10 one hr prior to treatment with 20 ng/mL FR901228. 19 hr post infection, the cells were analyzed for MICA/B or ULBP-2 surface expression or intracellular MICA/B expression by flow cytometry. The bar graphs show mean±SD from three experiments. E, The melanoma cell lines, FM-86 and FM-78, were mock infected (-) or infected with 0.1 MOI VSV10 for 19 hr and analysed for MICA/B surface expression by flow cytometry. The bar graphs show mean±SD from two experiments. For all the bar graphs, ** p<0.05 and *** p<0.0001.

