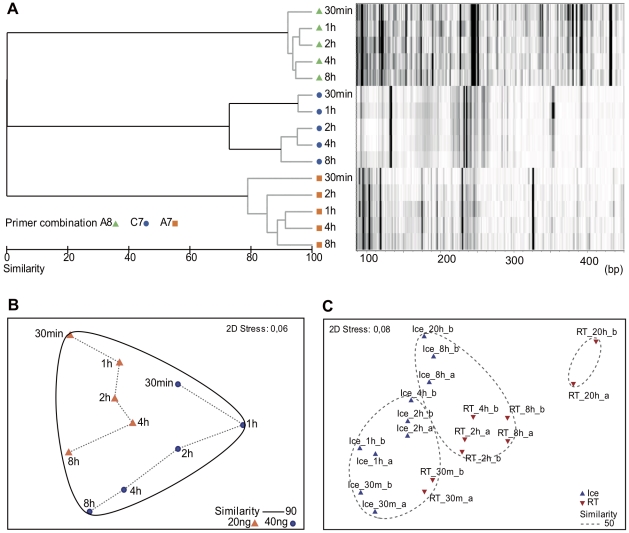
Figure 3. Comparison of TFA profiles from environmental samples filtered at progressively longer times after collection.
The shortest practical time was 30 minutes. A) and B) experiment carried out on October 3, 2007 with samples kept on ice; and C) timing experiment carried out on September 25, 2008. A) Cluster analysis from a Bray-Curtis similarity matrix of TFA done with three different primer combinations (A8, C7, and A7) from the same sample filtered at different times between 30 min and 8 h. Gray lines indicate differences were not significant at the 5% level. The lane next to each sample corresponds to the peak pattern (in a base pairs scale) of each sample in a virtual gel. B) NMDS diagram comparing fingerprints obtained using two initial RNA amounts with the A8 primer combination. C) NMDS comparison of samples kept on ice or at room temperature filtered at different times between 30 min and 20 h. Patterns were obtained with the A8 primer combination. Missing replicates are due to low quality electropherograms.

