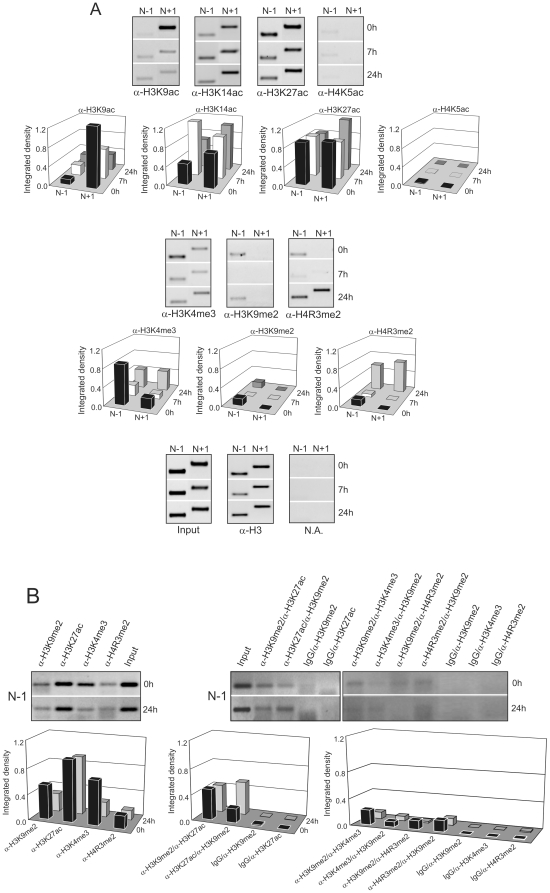
Figure 5. Nuc-ChIP and sequential-ChIP assays of site-specific epigenetic marks on nucleosomes near to Gas1 TSS vicinity.
(A) Histone acetylation and histone methylation marks at nucleosomes N-1 and N+1 of Gas1 promoter at 0 h, 7 h and 24 h after PH. The PCR bands were integrated by ImageJ software and corrected as in figure 3. The images are representative of at least three independent experiments. (B) Sequential ChIP analysis of “inactivating” (H3K9me2) and “activating” (H3K27ac, H3K4me3 and H4R3me2) epigenetic marks at nucleosome N-1 of Gas1 promoter. Both orders for first and second antibody are assayed. The PCR bands were integrated by ImageJ software and corrected as in figure 3. To subtract the background, the integrated density of a sample where first antibody was replaced by IgG was used. The images are representative of at least three independent experiments.

