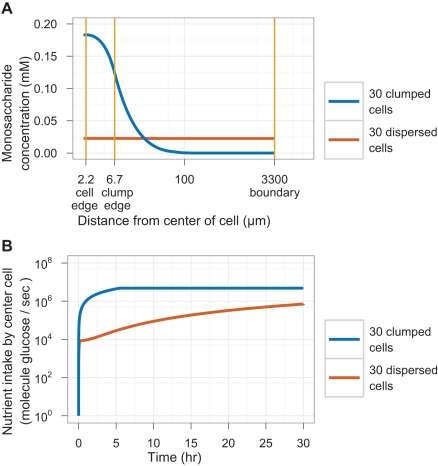
Figure 3. Simulation of glucose uptake in isolated cells and a cell clump.
The simulated local glucose concentration and glucose uptake of a cell inoculated at the center of a 150 µl sphere of 8 mM sucrose in two environments: at the center of a clump of 30 cells and at the center of a total of 30 cells uniformly dispersed throughout the volume. (A) Glucose concentration as a function of radial distance from the center of the cell after 30 h of incubation. Note the logarithmic scale on the x-axis. (B) Glucose intake rate of the cell as a function of time after inoculation. Note the logarithmic scale on the y-axis. See Supporting Information for details of code and parameters.

