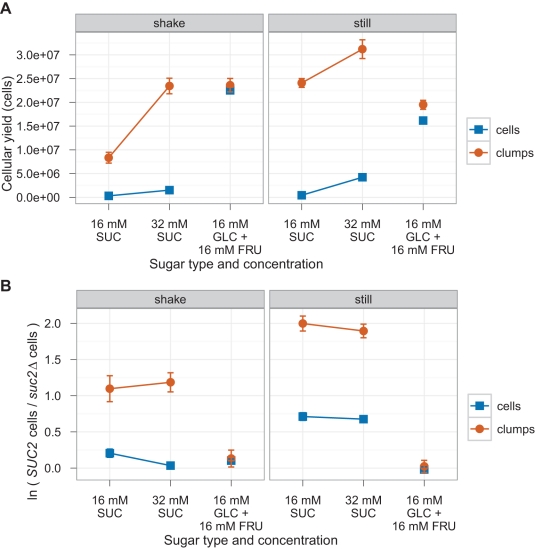
Figure 5. Competition between invertase producers (SUC2) and non-producers (suc2Δ).
60 SUC2 cells and 60 suc2Δ cells or three 15–25 cell SUC2 clumps and three 15–25 cell suc2Δ clumps were sorted into 150 µl wells at the given sugar concentration and allowed to grow for 72 h at 30°C. During incubation, the 96-well plates were either shaken at 1,000 RPM (left column) or left still (right column). (A) Cellular yield of SUC2 strains in competition with suc2Δ strains. Optical density (OD) values were converted to cell population by measuring the optical density of dilutions of a culture with known cell densities. (B) The growth advantage of various SUC2 strains over a suc2Δ strain. ln( SUC2 cells/suc2Δ cells) is proportional to the difference in the mean growth rate, assuming both strains start with an equal number of cells. The population frequencies were counted using a FACS machine: in half the samples SUC2 strains expressed mCitrine from the ACT1 promoter and suc2Δ strains expressed mCherry from the ACT1 promoter, and in the other half of the samples, the colors were reversed. Single cells expressed the amn1-W303 allele and clumps expressed the AMN1-RM11 allele. SUC2 strains yJHK401 (cell) and yJHK390 (clump) express mCitrine, and SUC2 strains yJHK410 (cell) and yJHK391 (clump) express mCherry. suc2Δ strains yJHK302 (cell) and yJHK433 (clump) express mCitrine, and suc2Δ strains yJHK437 (cell) and yJHK435 (clump) express mCherry. 24 samples were counted in each color combination. Error bars refer to the 95% confidence interval calculated using the one-sample Student's t test.

