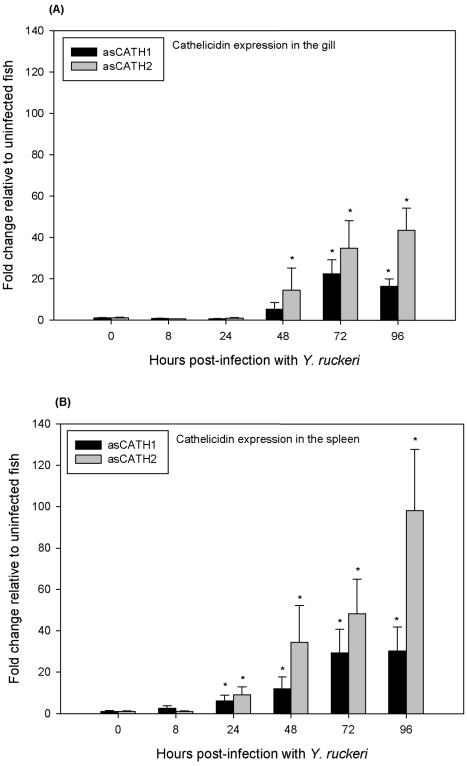
Figure 2. Relative expression of asCATH1 and 2 in the gill (A) and spleen (B) of Atlantic salmon post-infection with Y. ruckeri.
Gene expression was measured by quantitative real-time PCR. Expression at 8, 24, 48, 72 and 96 h post-infection was compared to expression at 0 h. Each bar represents the mean ± SE of at least 4 fish sampled at each time point. * indicates a significant upregulation of cathelicidin expression compared to expression at 0 h (p<0.05, as assessed by one-way analysis of variance and Dunnett's post-test).

