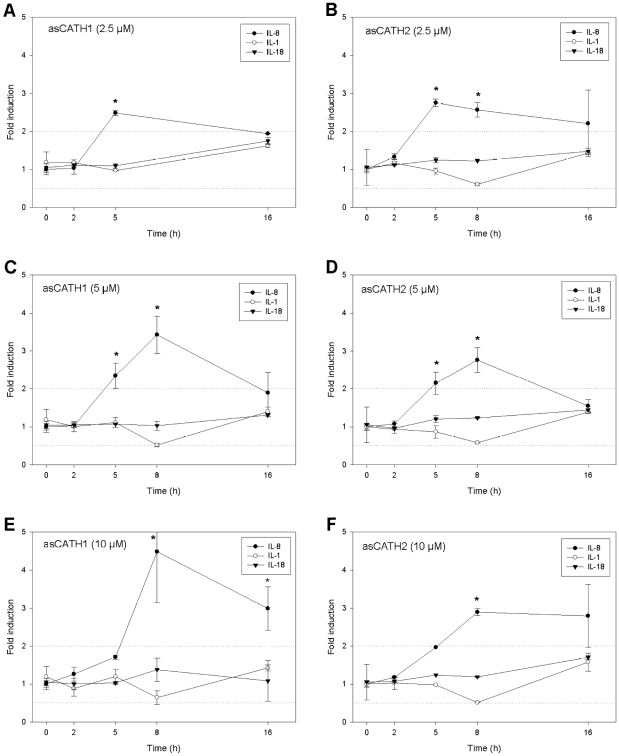
Figure 5. Kinetic profile of IL-8, IL-1 and IL-18 gene expression in Atlantic salmon peripheral blood leukocytes stimulated with asCATH1 (A,C,E) and asCATH2 (B,D,E).
Gene expression was assessed by real-time PCR at 0, 2, 5, 8 and 16 h post incubation with asCATH1 or asCATH2 at 2.5 µM (A,B), 5 µM (C,D) and 10 µM (E,F). Expression was normalised to the mean expression of four stable reference genes. Data shown are the means ± SE of quadruplicate PBL samples assayed in duplicate by quantitative real-time PCR and presented as fold induction compared to 0 h. * indicates a significant fold induction (P<0.05) compared to 0 h while the dotted line represents the minimum fold change (2 fold) deemed biologically significant.

