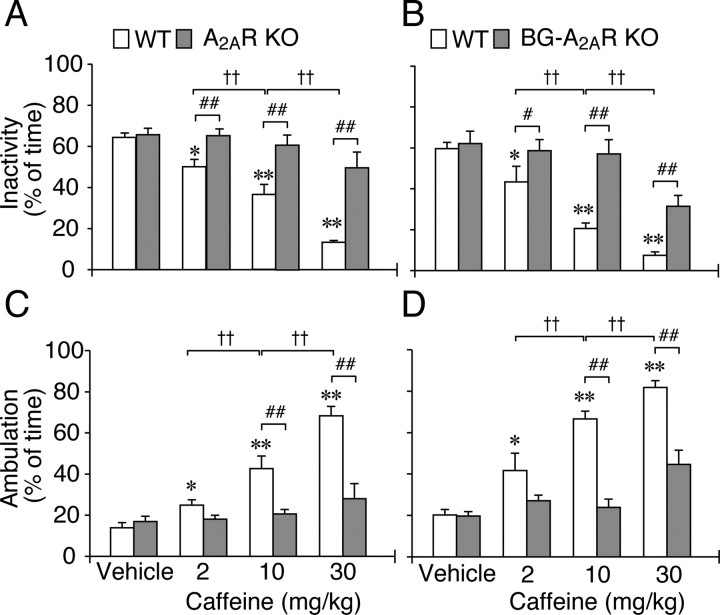
Figure 2.
Locomotion in A2AR KO and BG–A2AR KO mice after caffeine treatment. Rest–activity assessment was performed based on the amount of LMA in 50 s bins for 3 h after caffeine (2, 10, or 30 mg/kg) treatment. Time spent in inactivity (A, B) or high LMA (ambulation; C, D) is presented as percentage of total time (3 h). Data are presented as mean ± SEM (n = 8, per genotype and drug dose rest–activity assessment). *p < 0.05, **p < 0.01 compared with vehicle treatment within corresponding genotypes. #p < 0.05, ##p < 0.01 compared with corresponding WT littermates. ††p < 0.01 compared between caffeine doses.

