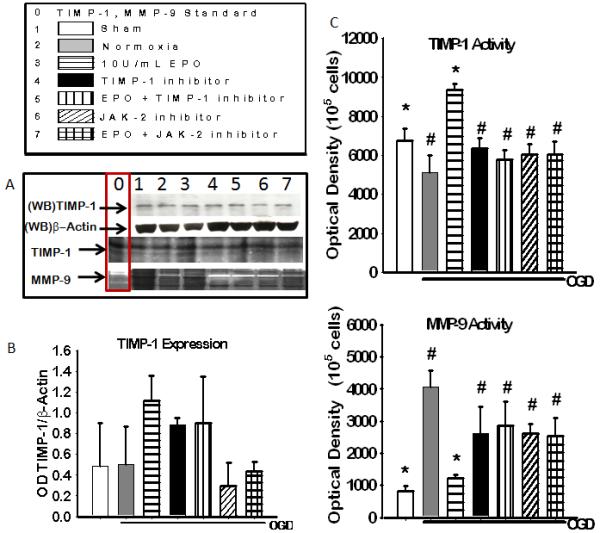
Figure 3. The Expression of TIMP-1 and Activity of TIMP-1 and MMP-9 in the presence of JAK-2 and TIMP-1 inhibitors 18 hours after OGD.

(A) Representative blot (WB) of TIMP-1 and b-actin expression and coomassie blue stain of TIMP-1 activity (dark bands) and MMP – activity (light bands), column 0 shows positive controls for TIMP-1 and MMP-9. (B)Densitometric quantification of western blot for TIMP-1 expression. (C) densiometric calculation of reverse zymography of TIMP-1 activity. (D) Densiometric quantification of zymography of MMP-9 activity. Data represent the mean (±SD): n = 6 in all groups represented in B,C and D. * P < 0.05 in all group compared to untreated. # P < 0.05 compared to 10U/mL EPO treated group. EPO treatment increased TIMP-1 activity and expression and reduced MMP-9 activity.
