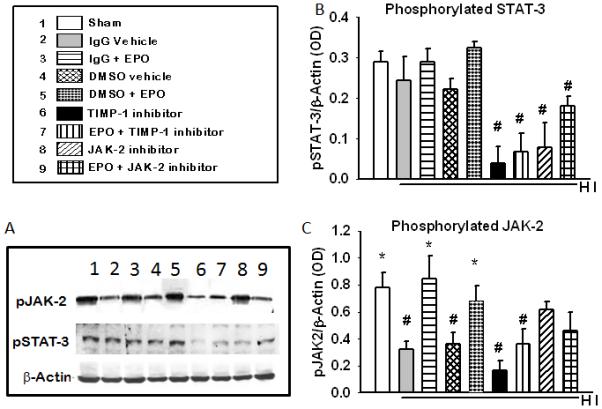
Figure 5. The profile of phosphorylated JAK-2 and phosphorylated STAT-3 in the ipsilateral cortex of the brain of HI rats (48 hrs) after inhibition of JAK2 or TIMP-1.

(A) Shows a representative blots of pJAK-2, pSTAT-3 and the b-actin used as the loading control. (B) JAK-2 phosphorylation in the presence of JAK-2 and TIMP-1 inhibitors. (C) STAT-3 phosphorylation in the presence of JAK-2 and TIMP-1 inhibitors. Data represent the mean (±SD): n = 6 in all groups. .* P< 0.05 compared to untreated. # P< 0.05 compared to the 10U/ml EPO treated group. EPO treatment increase the phosphorylation of JAK-2 and STAT-3 and the inhibitors decreased both.
