
Fig. 4.
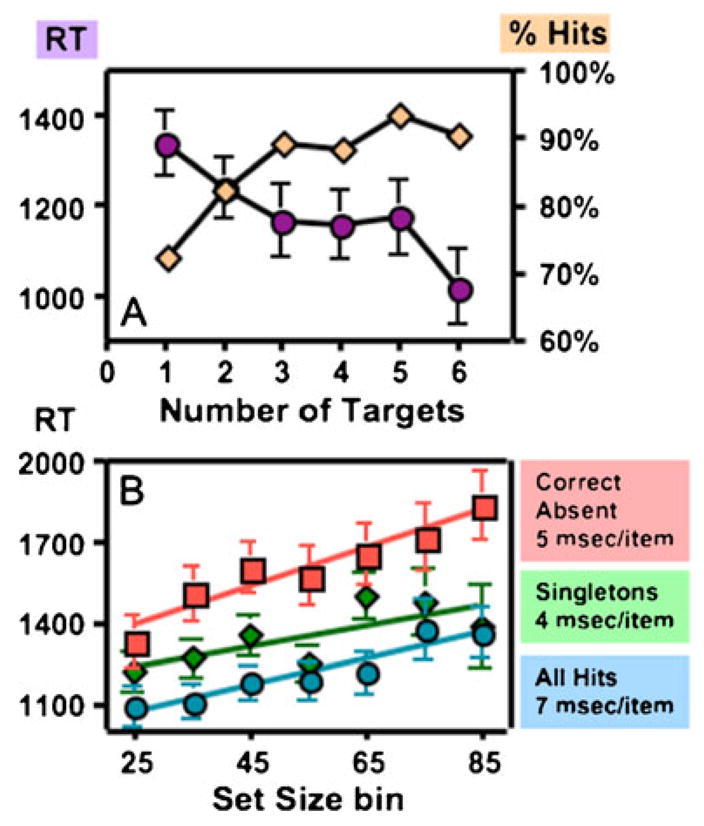
[COMP: Label top panel “A.” and bottom “B.”, as referred to in text.]Effects of number of targets. Panel a shows that, as the number of instances of a target increases, average RT decreases (purple circles) and hit rate increases (beige diamonds). Panel b shows average RTs binned by set size for hits (blue circles) and correct absent trials (red squares) (essentially duplicating Fig. 2). Green diamonds show singleton hits. All error bars indicate ±1 SEM