
Fig. 6.
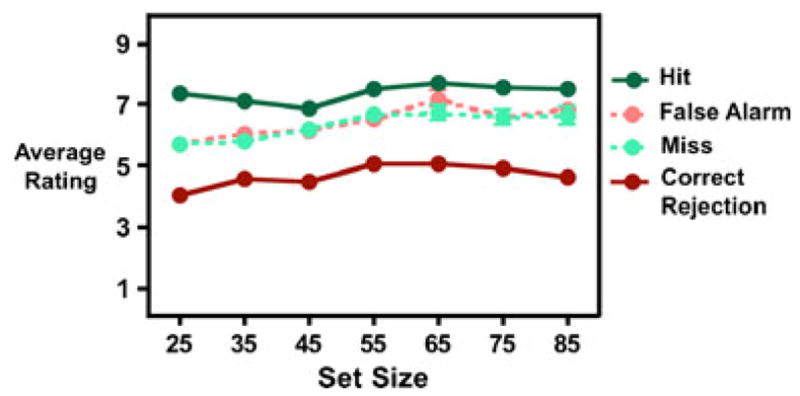
Average typicality ratings as a function of set size and trial type. Error bars (±1 SEM) are generally smaller than the data point
Official websites use .gov
A
.gov website belongs to an official
government organization in the United States.
Secure .gov websites use HTTPS
A lock (
) or https:// means you've safely
connected to the .gov website. Share sensitive
information only on official, secure websites.
Average typicality ratings as a function of set size and trial type. Error bars (±1 SEM) are generally smaller than the data point