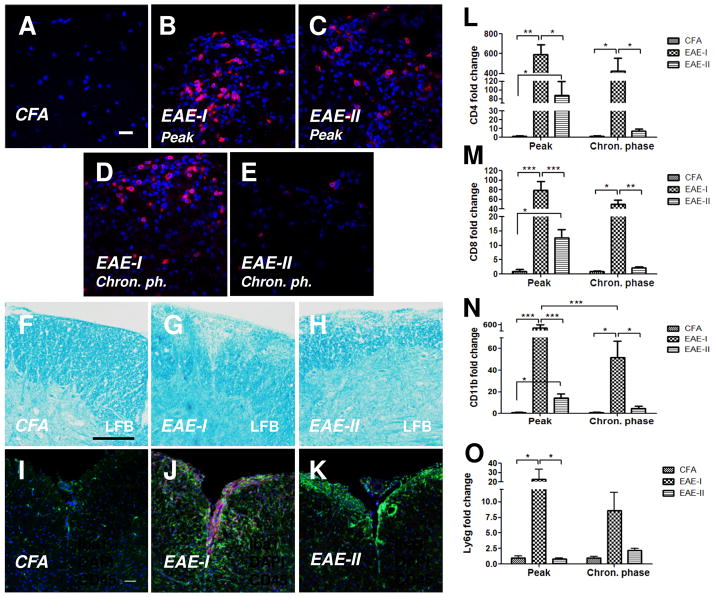
Figure 2. EAE-I is characterized by severe demyelination and massive spinal cord infiltration.
Lumbar spinal cords of saline treated mice in the CFA control, EAE-I and EAE-II groups were examined for demyelination and mononuclear cell infiltration at the peak and the chronic phase of EAE (day 45). CD4+ T-cells were found in the spinal cord parenchyma of EAE-I (B, D) and EAE-II (C, E) animals at both time points. No CD4 expressing cells were observed in the CFA-control (A). Demyelinating plaques were detected in the spinal cords during the chronic phase of EAE using LFB staining (F-H). Higher level of myelin loss was found in EAE-I (G) compared to EAE-II (H). In addition, a dramatic increase of Iba+ macrophages/microglia was shown throughout the coronal sections of the spinal cords in EAE-I (J) vs EAE-II (K). The number of CD45+ cells (I–K) was also markedly elevated in EAE-I spinal cords when compared to the CFA control or EAE-II. qPCR analysis revealed increased levels of mRNAs encoding CD4 (L), CD8 (M), CD11b (N) proteins in EAE-I and EAE-II animals at the peak of disease (n = 4–7). Cell infiltration in EAE-I was significantly higher when compared to EAE-II. An increase of Ly6g mRNA level was detected only in EAE-I animals at the peak of disease (O). *, p < 0.05; **, p < 0.01 and ***, p < 0.001. Scale bars: A-E, D-L, 50 μm; F-H, 200 μm.

