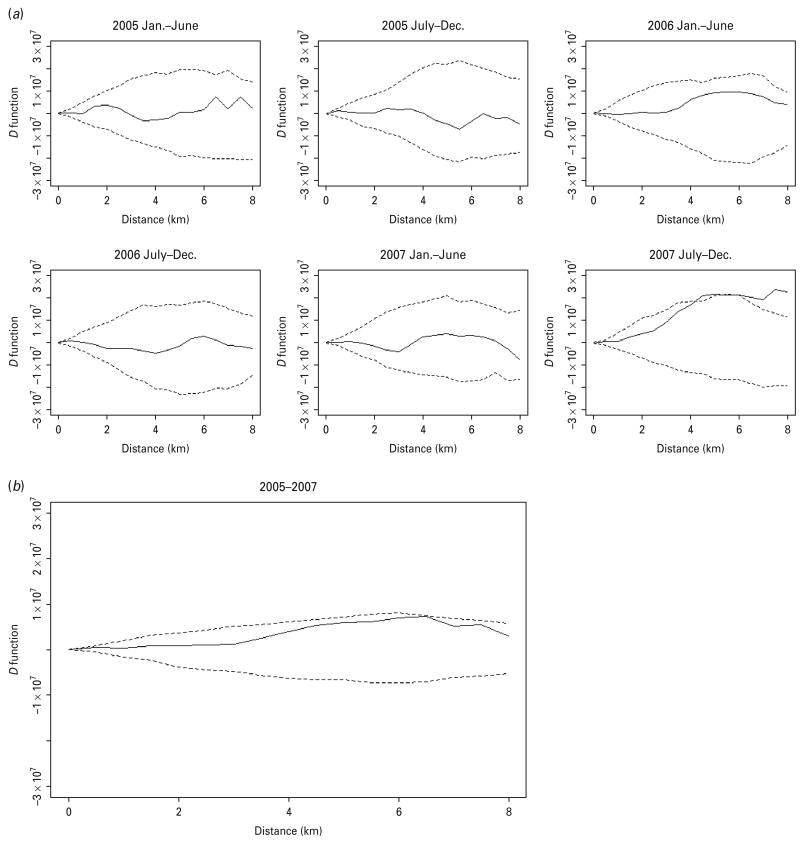
Fig. 2.
The spatial D function (KDR – KNDR) and 95% simulation envelope of tuberculosis cases. (a) Period-specific D function by 6-month interval; (b) aggregated D function over total study period. Different locations of the observed D function compared to the simulation envelope indicate different relative spatial aggregation of the two types of cases. When the D function is above the simulation envelope, this is consistent with increased aggregation of multidrug-resistant (MDR) cases (relative to non-MDR cases); when it is within the simulation envelope, this is consistent with similar aggregation of the two types of cases; when it is below the simulation envelope, this is consistent with increased aggregation of non-MDR cases.

