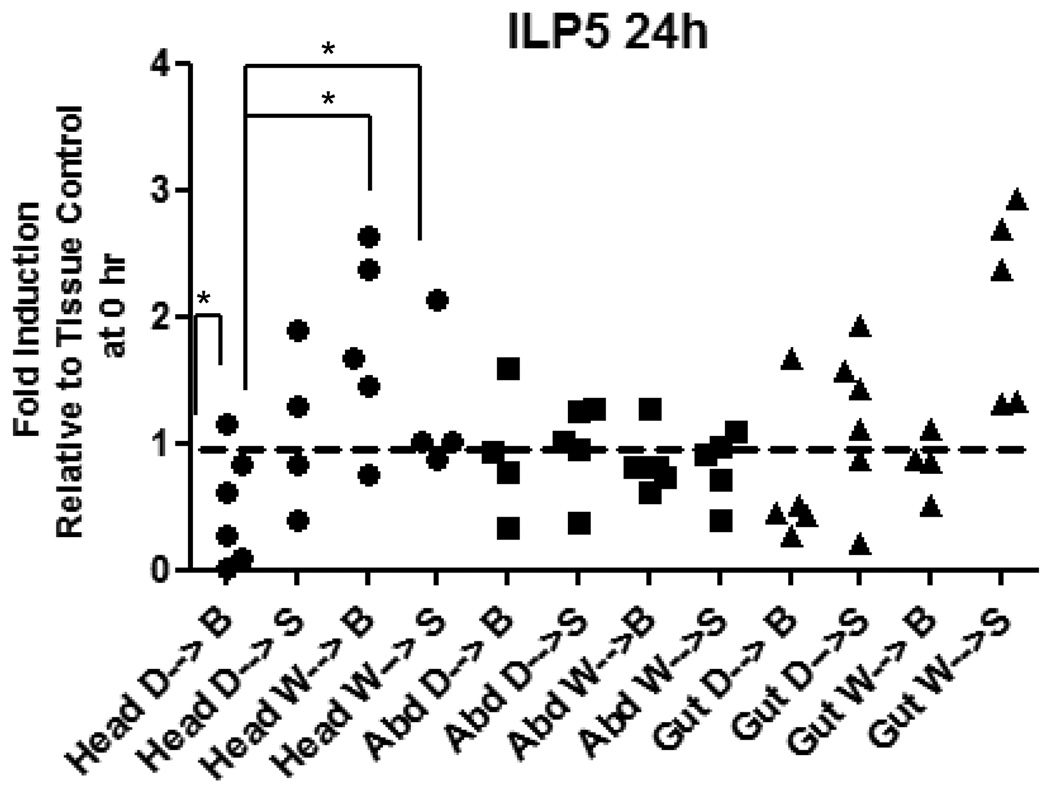
Figure 5. Expression of AnsILP5 is induced in the head of female An. stephensi following blood and sugar ingestion, a response that is blunted by prior deprivation.
Females were given water only (W) or deprived of both sugar and water (D) for 24 h prior to feeding on a sugar solution (S) or washed red blood cells (B). Total RNAs from the head, abdominal body wall (Abd), and gut tissue (midgut, hindgut, Malpighian tubules) were isolated prior to feeding (0 h control) and at 24 h after feeding for qRT-PCR analysis of AnsILP expression. AnsILP expression levels are shown relative to 0 h expression in the matched tissue control, which is set at “1” (dashed line). For statistical analysis, data were log-transformed and analyzed by ANOVA followed by Newman-Keuls post-test (α = 0.05).

