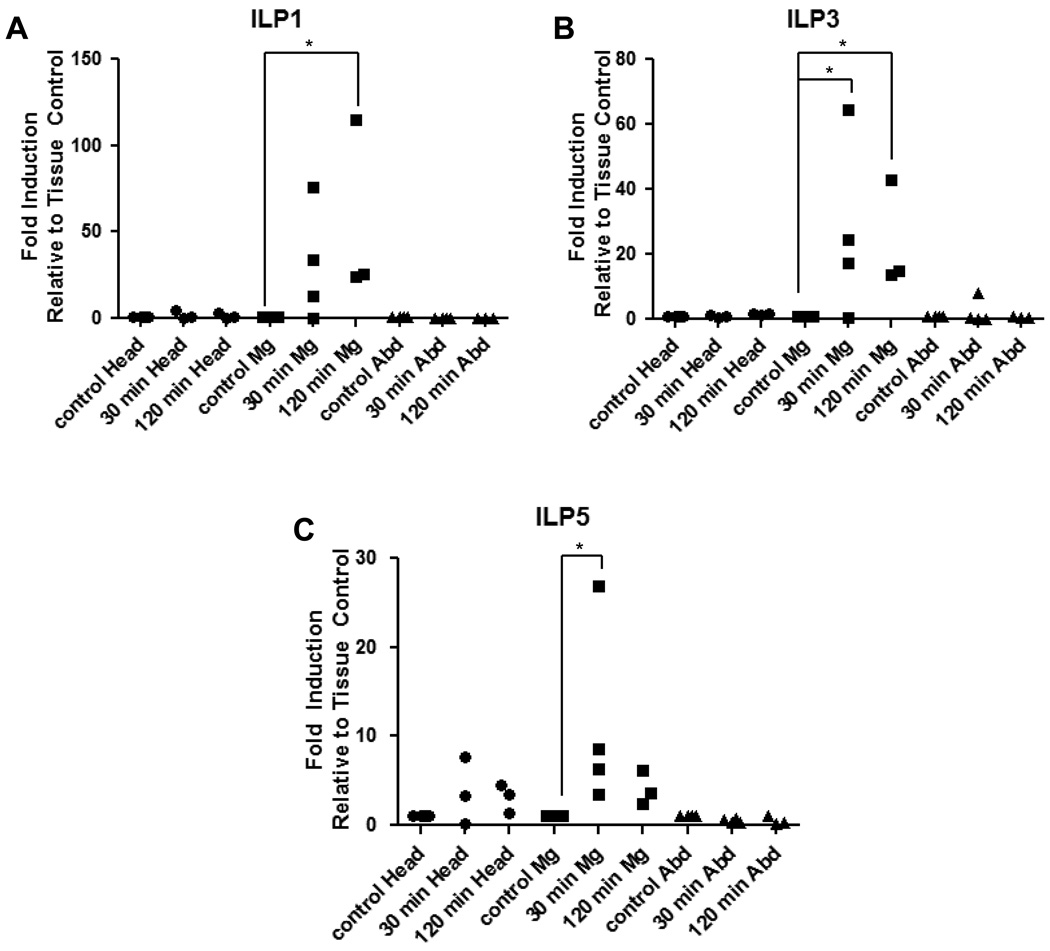
Figure 6. Expression levels AnsILPs 1, 3, and 5 are induced in the midgut of female An. stephensi midgut in response to ingested human insulin.
Females were held on water for 24 h prior to feeding on washed red blood cells (RBC) supplemented with 170 pM human insulin. Head, midgut (Mg), and abdominal body wall (Abd) tissues were isolated for qRT-PCR analysis of (A) AnsILP1, (B) AnsILP3, and (C) AnsILP5. AnsILP expression in response to ingested insulin/RBC is shown relative to expression in matched tissue controls (set at “1”) from An. stephensi fed on RBC without added insulin. For statistical analysis, data were log-transformed and analyzed by ANOVA followed by Newman-Keuls post-test (α = 0.05).

