Figure 5.
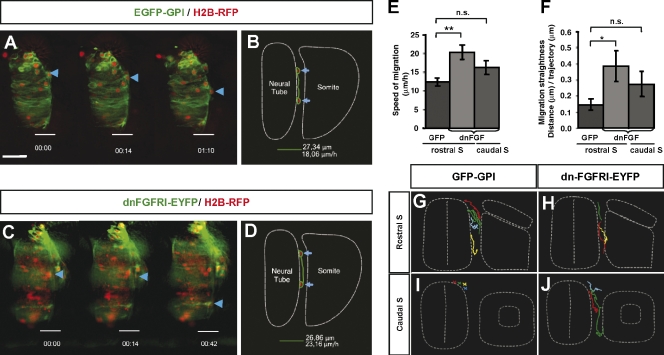
Analysis of migratory behavior in NCCs after FGF signaling blockage. (A–D) Chicken embryos at stages HH10 and 11 electroporated on the right neural hemitube with H2B-RFP (red) and with GFP-GPI or dn-FGFR1-EYFP (both green) and analyzed for imaging 14–16 h later. Selected frames taken from a control GFP-GPI (A)– or a dn-FGFR1-EYFP (C)–electroporated embryo at the level of differentiating somites (somite V). Blue arrows and arrowheads point to the same cell along the different frames. The trajectories of cells indicated in A and C are reflected in schemes B and D, respectively. (E and F) Quantitative analysis using MetaMorph software of the speed (E) and straightness (F) of NCC migration analyzed at the level of differentiated or epithelial somites. Error bars indicate the SD of n = 10. Statistical significance was examined by Student’s t test. *, P < 0.04; **, P < 0.003. n.s., not significant. (G–J) A schematic representation of the trajectories followed by electroporated NCCs either with control EYFP (G and I) or dn-FGFR1-EYFP (H and J) of four representative embryos at the level of epithelial somites (I and J) or differentiating somites (G and H). Bar: (A, for A and C) 20 µm.

