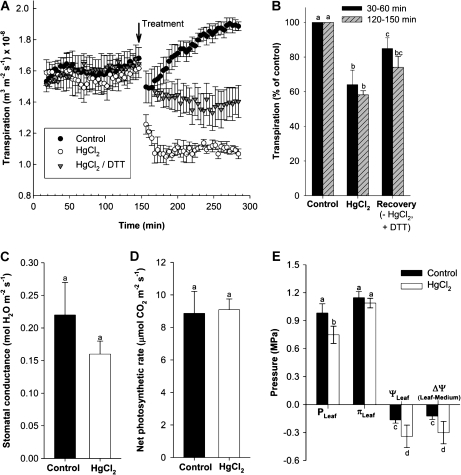
Fig. 3.
Daytime transpirational water loss of 14- to 15-d-old barley plants in response to the aquaporin inhibitor HgCl2 and reducing agent DTT. Water loss was measured for >2 h before 50 μM HgCl2 (5 min) was added to the root medium and water loss measured again (HgCl2). In some experiments, plants were exposed, in quick succession, to 50 μM HgCl2 (5 min) and 5 mM DTT (15 min) before being analysed again (HgCl2/DTT). Plants which had normal growth medium exchanged for medium devoid of reagents were used as control. (A) Continuous recording of water loss. Each trace is the average +SD (error bars) of three plant analyses. (B) Mean change in transpiration rate in response to treatment, expressed as a percentage of the control (=100%). Means were calculated from values at 30–60 min and 120–150 min after the treatment shown in (A). (C) Stomatal conductance and (D) net photosynthetic rate in control and Hg-treated plants. Measurements were taken 60–150 min after treatment; DTT recovery was not tested. Values are means ±SD of four plants. (E) Effect of Hg treatment on cell turgor pressure (PLeaf) and leaf osmotic pressure (πLeaf) and water potential (ψLeaf). The resulting gradient in water potential (Δψ) between root medium (–0.04 MPa) and leaf is also shown. Values are given as means ±SD of four leaf analyses. Statistical significance of difference is indicated by different letters (P<0.05).

