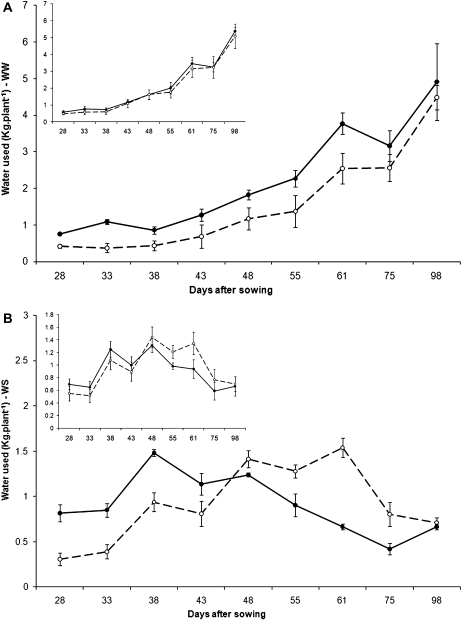
Fig. 1.
Variation in water uptake profile in two chickpea genotypes contrasting for the drought stress index (DTI) under terminal drought stress (sensitive ICC 8058, closed symbols and solid lines; tolerant ICC 867, open symbols and dashed lines) and grown under (A) well watered and (B) water-stressed conditions. Water stress imposition was initiated by giving a final irrigation at 23 DAS. Plants were grown in 1.2 m lengh PVC cylinders. The water extraction values are those for the period finishing at the date when the data are plotted. For instance, water extracted at 28 DAS corresponds to that in the period between 23 and 28 DAS. Insets in (A) and (B) show the water uptake profile for the group of tolerant and sensitive entries under each water regime. Data for the sensitive group are the mean of water use data across all sensitive lines except ICC 2507 (closed symbols and solid lines). Data for the tolerant group are the mean of water use data across all sensitive lines except Annigeri and ICC 4958 (open symbols and dashed lines).

