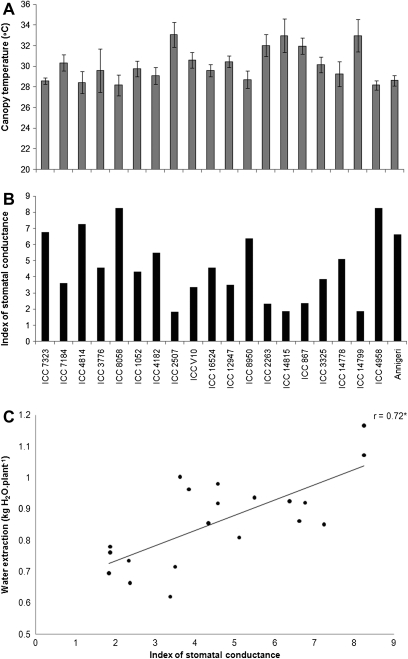
Fig. 3.
Variation of canopy temperature (°C) (A) and index of stomatal conductance (Ig) (B) in chickpea genotypes contrasting for terminal drought tolerance index (DTI) grown in 1.2 m lengh PVC tubes under water stress. Values are means ±SE of data collected at 32 and 37 DAS. Relationship between water extraction (kg H2O plant−1) and the index of stomatal conductance (Ig) (C) measured using infrared thermography in chickpea genotypes contrasting for terminal drought tolerance index (DTI) grown in 1.2 m lengh PVC tubes under water stress. Water extraction values are the means of those for the period 28–33 DAS and 33–38 DAS and Ig values are means of data collected at 32 and 37 DAS. Genotypes are sorted out in order of increasing DTI on the x-axis, within group of sensitivity and tolerance.

