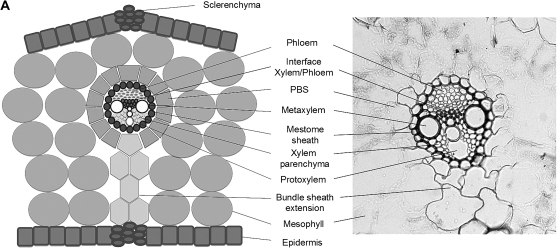
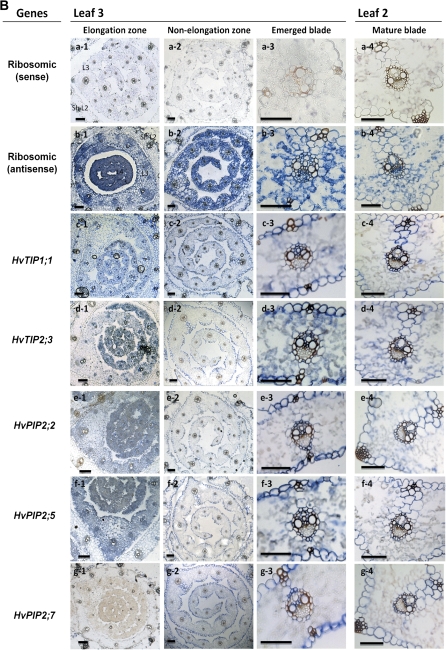
Fig. 7.
Tissue-specific expression of barley MIPs in leaf regions. (A) Scheme and micrograph of a cross-section of a mature blade, identifying tissues. (B) In situ hybridization data. Expression is shown as blue colour, and was detected using antisense probes of genes of interest. An antisense designed against 18S ribosomal RNA was used as positive control. A sense probe was tested for all genes as negative control and is shown representatively for ribosomal RNA. PBS, parenchymatous bundle sheath; L3, leaf three; Sh L2, sheath of leaf two; scale bar=50 μm.


