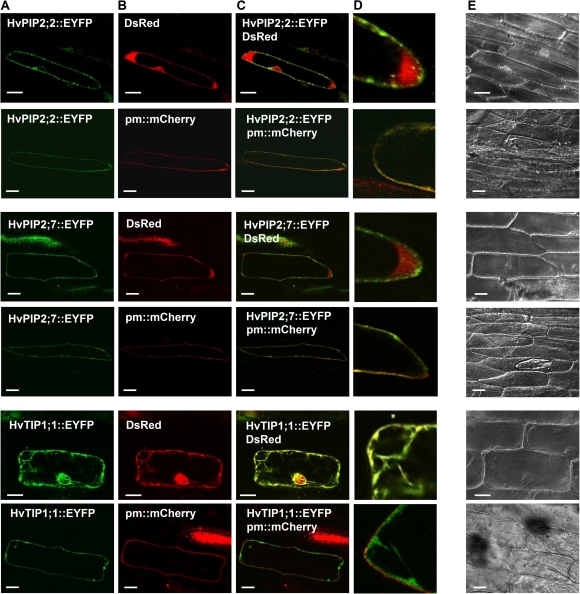
Fig. 8.
Subcellular localization of barley MIPs as studied through transient (2 d) expression in onion epidermis. Expression was viewed in epidermal peels using an Olympus FV1000 confocal laser scanning microscope. (A) Candidates genes fused to the enhanced yellow fluorescent protein (EYFP); (B) Cytoplasm marker pSAT6-DsRed2-N1 (DsRED, red fluorescence) and pBIN20-plasma membrane-mCherry marker (pm mCherry, red fluorescence); (C) overlay of (A) and (B); (D) magnified parts of cells shown in (C); (E) transmitted light micrographs of cells shown in (A) to (D). Scale bar (A, B, C, E)=50 μm, Scale bar (D)=25 μm.

