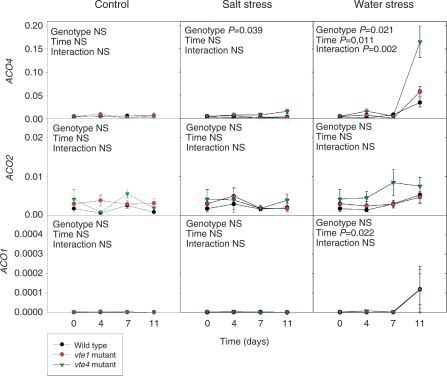
Fig. 2.
Time-course evolution of relative expression of the ethylene biosynthesis genes, ACO4, ACO2 and ACO1 in young leaves of the wild type and vte1 and vte4 mutants of A. thaliana plants exposed to control, salt stress or water stress conditions for 11 d. Data are the mean ± SE of n = 4 experiments. Significant differences between genotypes, time of measurements and their interaction (genotype × time) are given in the panels (ANOVA, P ≤ 0.05). NS, not significant. GAPDH was used as the reference gene to calculate the relative expression of the ethylene biosynthesis genes.

