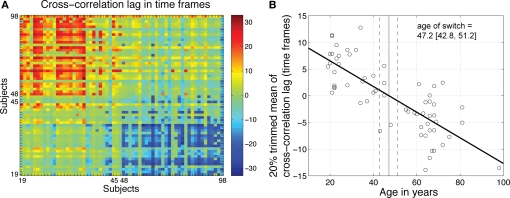
Figure 13.
Age-related qualitative changes in R2 functions. (A) For each subject on the x-axis, the y-axis indicates the cross-correlation lag for maximum correlation between that subject and all the other subjects. The R2 functions from younger subjects did not need to be shifted much to maximize their overall similarity. However, their functions needed to be shifted to the right (positive shift, in red) to maximize the similarity with older functions. The reverse was true for older subjects. (B) For each subject, the 20% trimmed mean of the cross-correlation lags provides an indication of its overall similarity to other subjects. Younger subjects tended on average to have a positive lag, whereas older subjects tended to have a negative lag. There was a significant relationship between mean lags and age (R2 = 0.61, P = 0). The age at which a lag of 0 was observed provided an estimate of the age of a qualitative switch in brain activity.

