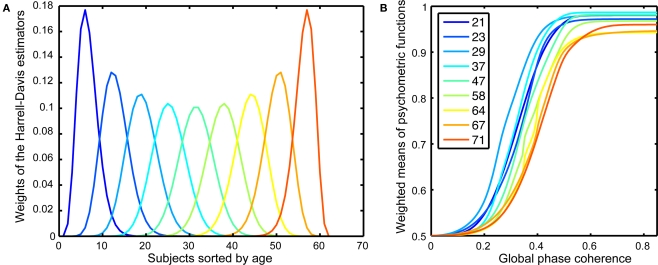
Figure 2.
Psychometric functions. (A) Weights of the Harrell–Davis estimator of the deciles of the subjects’ age distribution. These weights were applied to the individual behavioral psychometric functions to create weighted means for different age groups, as shown in (B). The inset shows the colors corresponding to the different age deciles. The age deciles are closer together for subjects under 30 and over 60, reflecting a larger sampling of these age groups.

