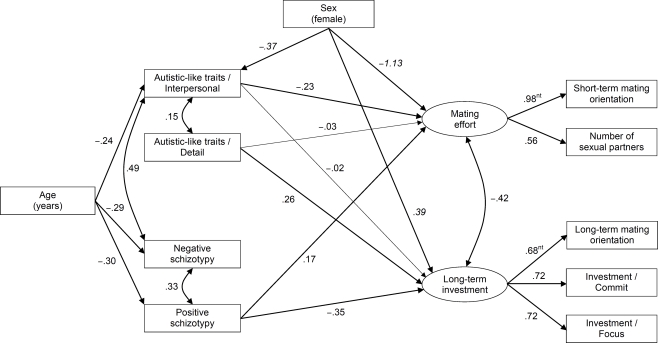
Figure 2.
Standardized path diagram of the selected model. For clarity of presentation, variances, disturbances, and measurement errors are omitted. The effects of sex (italicized) are reported as standardized differences between males and females (d). Individual paths that were statistically significant in the unstandardized solution (p < 0.05) are drawn with thick lines. Legend: nt = not tested for significance (fixed loading).

