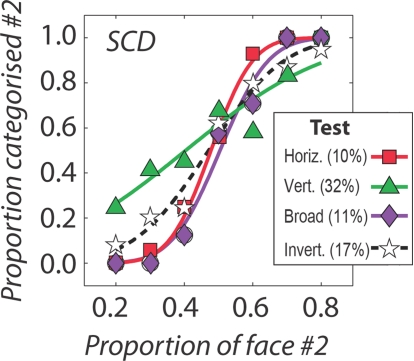
Figure 5.
Psychometric functions are shown for the discrimination of upright/broadband faces (in purple), inverted/broadband faces (in black/white), horizontally filtered upright faces (in red) and vertically filtered/upright faces (in green). Identity thresholds - the identity levels eliciting 82% accurate discrimination - are given in parentheses.

