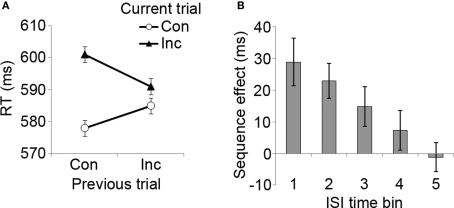
Figure 2.
Congruency sequence effects as a function of ISI length. (A) Mean RT data as a function of previous and current trial congruency, displaying the classic CSE data pattern. Con, congruent trial; Inc, incongruent trial. (B) The magnitude of the CSE ([CI − CC] − [II − IC]) as a function of ISI duration (positive values indicate the magnitude of RT reduction following an incongruent compared to a congruent trial). ISI time bins: 1 = 500–1,000 ms, 2 = 1,500–2,000 ms, 3 = 2,500–3,000 ms, 4 = 4,000–5,000 ms, 5 = 6,000–7,000 ms. Error bars reflect mean standard errors (after Masson and Loftus, 2003) for CSE interaction effects.

