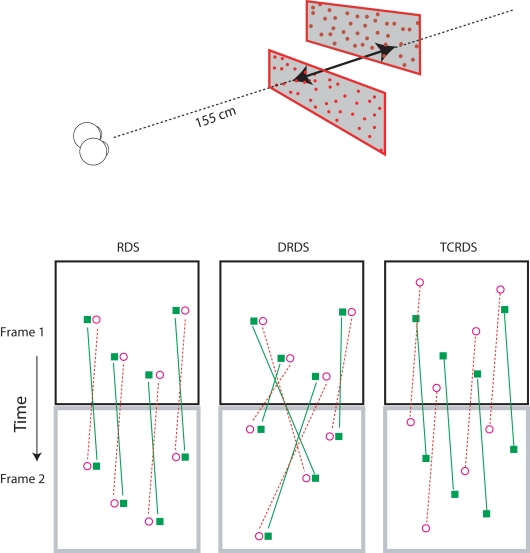
Figure 2.
Top: The stereograms simulated motion-in-depth of two panels of dots moving in opposite directions. Bottom: The motion-in-depth is signaled by either a RDS (left panel), a DRDS (middle panel), or a TCRDS (right panel). The filled squares represent dots in the left eye and the open circles are the dots in the right eye. Figure reprinted with permission from Nefs and Harris (2010).

