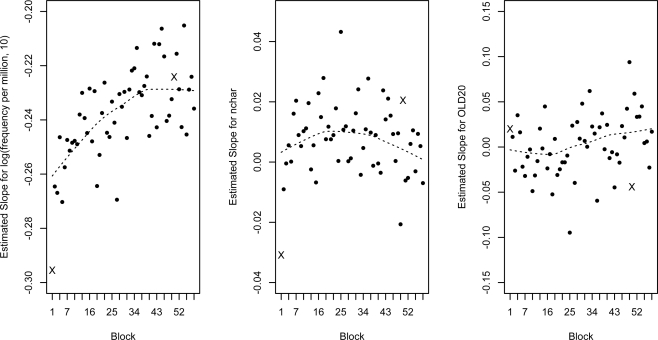
Figure 3.
Estimated slopes (in standard deviations) for the linear effects of word frequency (A), word length (B), and OLD20 (C) in each block. The estimates for block 1 and block 50 are marked with an “X.” The dotted line shows the locally weighted scatterplot smoothing (LOWESS; Cleveland, 1979), excluding block 50.

