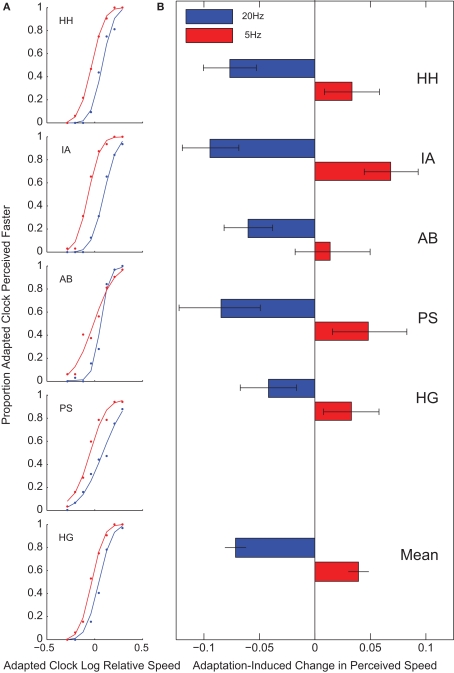
Figure 3.
Perceived speed. In Experiment 2, observers reported which of two clocks appeared to move faster. A 20-Hz adaptation caused a clock in an adapted region to appear to move more slowly than a clock in an unadapted region, and 5-Hz adaptation caused a clock to appear to move more quickly. (A) Psychometric functions for individual subjects following 5- (red) and 20-Hz (blue) adaptation. (B) Points of subjective equality. Error bars on individual subject data indicate 95% confidence intervals; error bars on mean data indicate standard errors.

