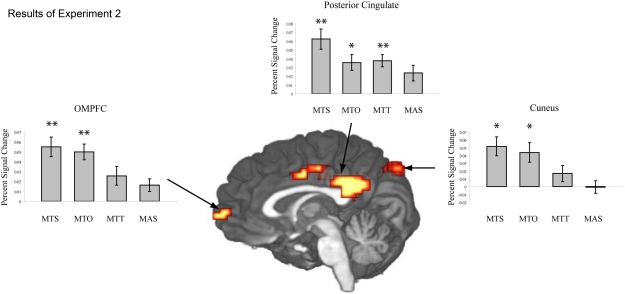
Figure 2.
The Z-map in the center shows the results of the whole brain analysis from Experiment 1. Greater levels of activation are seen along the cortical midline in the orbitomedial prefrontal cortex (OMPFC), posterior cingulate (PC) and cuneus (CUN) for sentences describing objects in motion toward oneself vs. sentences describing static objects. The histograms show mean activation (percent signal change) within these regions for the experimental sentence conditions presented in Experiment 2: MTS = movement toward self, MTO = movement toward other, MTT = movement toward thing, MAS = movement away from self. Activation in the cortical midline structures is significant for both MTS and MTO sentences, but not for MTT or MAS sentences. A single asterisk indicates a difference significant at the 0.05 level, and two asterisks indicate a difference significant at the 0.01 level.

