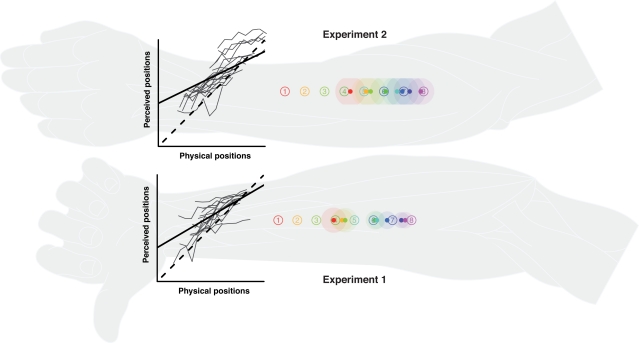
Figure 2.
Single stimulus localization in experiments 1 and 2. Numbered circles indicate physical stimulus positions averaged over all participants. Colored dots indicate average perceived positions, surrounded by a halo designating variability in terms of SEMs. The line graphs show the relationship between perceived and physical positions. The lengths of the axes equate to individual arm length. Thin gray lines: individual localization profiles averaged by position; black straight line: the group regression based on the averaged individual regression parameters; black dashed line: the (theoretical) gradient of absolute correspondence between the two dimensions, values above indicating proximal and values below denoting distal displacements. Individual data were processed in respect to the distal–proximal dimension of the forearm and normalized to individual arm lengths, measured as the distance between wrist and elbow (see Data Preprocessing). All positions are shown in units of this normalized armlength.

