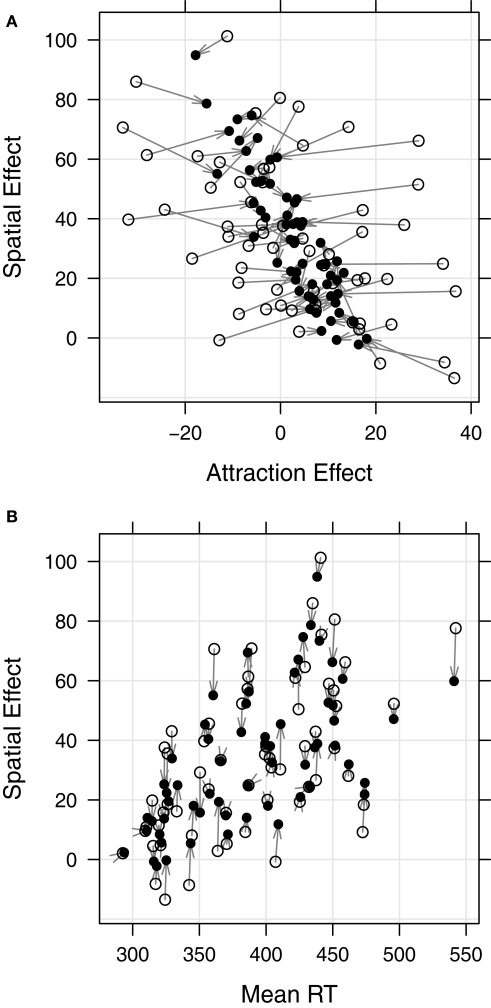
Figure 3.
(A) Scatterplot for spatial and attraction effects. Filled symbols show conditional modes of the distributions of random effects, given the observations and evaluated at the parameter estimates. Open symbols show within-subject estimates. Arrows connect the two values for each subject. Shrinkage correction reveals a very strong negative correlation between spatial and attraction effects. LMM correlation estimates and within-subject correlations are reported for all effects in Table 1. (B) Analogous scatterplot for spatial effect over mean RT. Vertical arrows in this panel indicate that there is almost no shrinkage for mean RTs.

