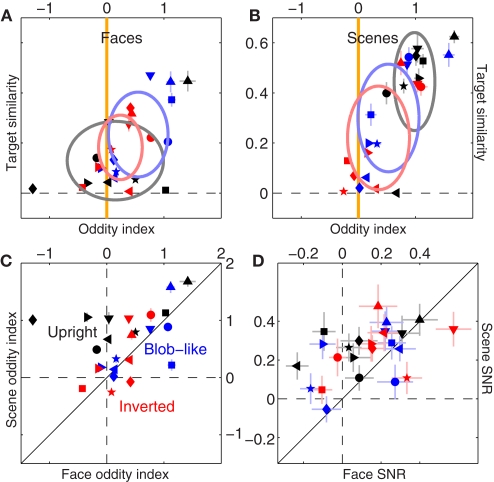
Figure 13.
Differential effect of scenes versus faces on filter shape. (A,B) Are plotted to the same conventions of Figure 5C, separately for faces (A) and scenes (B). (C) Plots oddity index for scenes (y axis) versus faces (x axis); (D) reports filter SNR using similar plotting conventions. Data has been pooled from both natural and phase-only datasets.

