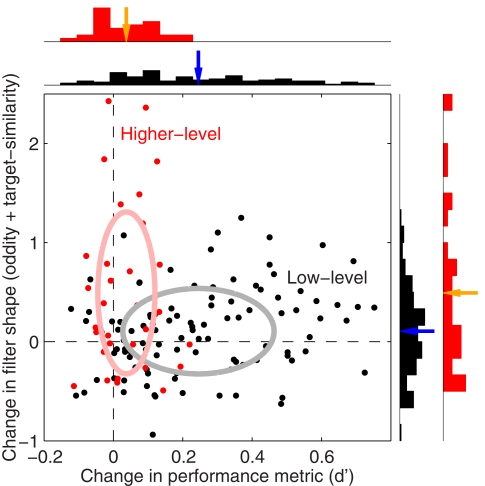
Figure 15.
Low-level manipulations change sensitivity, higher-level manipulations change filter shape. Change in sensitivity (d′ log-ratio) is plotted on the x axis versus change in filter shape (y axis) as assessed using an index that combines both oddity and target similarity (see Section 2.7), for both low-level image manipulations (e.g., blob-like transformation) in black and higher-level manipulations (image inversion) in red. See Section 2.7 for details on how different comparisons were classified as low-level or higher-level. Top and right histograms plot distributions; arrows show mean values.

