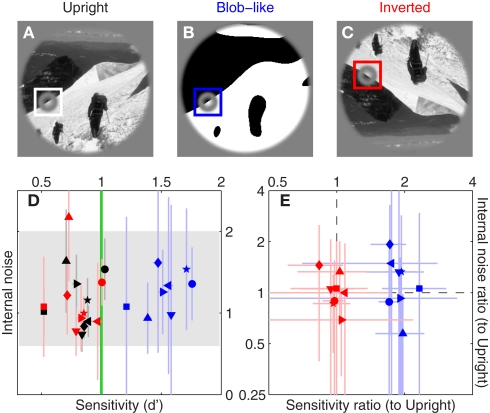
Figure 3.
Sensitivity and internal noise for upright natural (A), blob-like (B) and inverted images (C); color-coding is black, blue and red respectively. (D) Plots d′ on the x axis versus internal noise on the y axis (see Section 2.4 for details on how the latter was estimated). Gray shading shows internal noise range expected from previous studies (Neri, 2010a); green vertical line shows the desired d′ target value of 1 (Murray et al., 2002). (E) Plots ratios between d′ for blob-like and d′ for upright natural images (blue) on the x axis, versus ratios between internal noise for blob-like and internal noise for natural images on the y axis. Red symbols plot the same but for inverted instead of blob-like images. Dashed lines indicate unity ratios. Each symbol refers to a different observer. Error bars show ±1 SEM.

