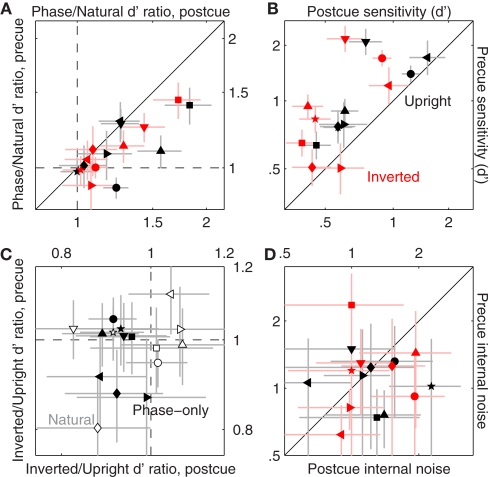
Figure 9.
Comparison between sensitivity to natural and phase-only images. (A) Plots the ratio between d′ for phase-only images and d′ for natural (unmanipulated) images, from precue trials (y axis) versus postcue trials (x axis). Dashed lines indicate unity ratios. (B) Plots d′ for phase-only images, from precue trials (y axis) versus postcue trials (x axis); (D) plots internal noise in the same way. (C) Plots the ratio between d′ for inverted images and d′ for upright images, from precue trials (y axis) versus postcue trials (x axis) and for both the original images (open) and the phase-only images (solid).

