FIGURE 1.
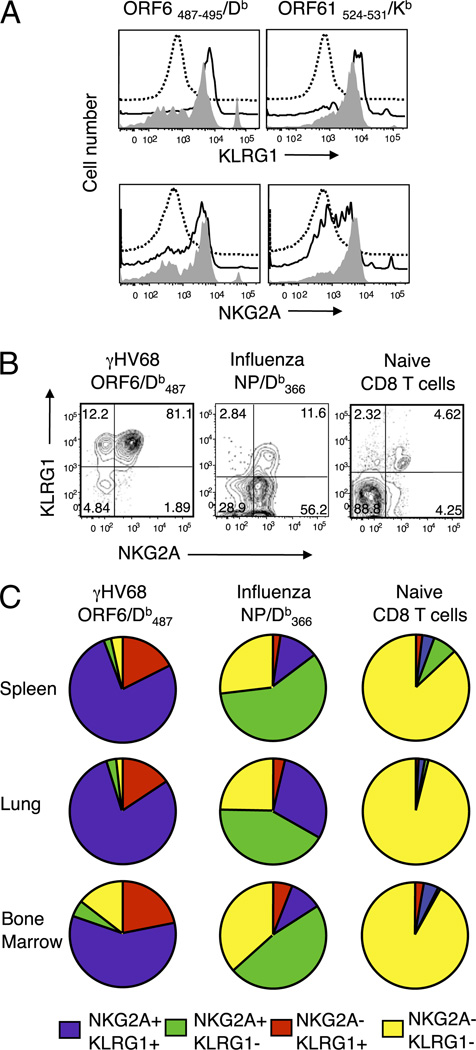
Expression of KLRG1 and NKG2A on γHV68-specific CD8 T cells during long-term infection. Mice were infected with γHV68, influenza virus, or kept as naive age-matched controls, and tissues were analyzed at the indicated times p.i. A, Representative histograms showing KLRG1 and NKG2A expression on CD8 T cells isolated from naive mice (dotted line) and on γHV68-specific CD8 T cell splenocytes (ORF6487–495/Db [left panels] and ORF61524–531/Kb [right panels]) at 3 wk p.i. (continuous line) and at 3 mo p.i. (gray fill). B, Representative dot plots showing KLRG1 and NKG2A coexpression in naive mice and in γHV68- or influenza virus-infected mice at 3 mo p.i. Splenocytes were gated on γHV68 ORF6487–495/Db-specific CD8 T cells, influenza virus NP366–377/Db-specific CD8 T cells, or total CD8 T cells (naive mice), and numbers indicate percentage of cells in the quadrant. C, Pie charts show the distribution of NKG2A and KLRG1 expression in the spleen, lung, and bone marrow of mice infected 3 mo earlier with γHV68 (left column), influenza virus (center column), or kept as naive age-matched controls (right column). Results were gated on virus-specific or naive CD8 T cells as indicated above.

