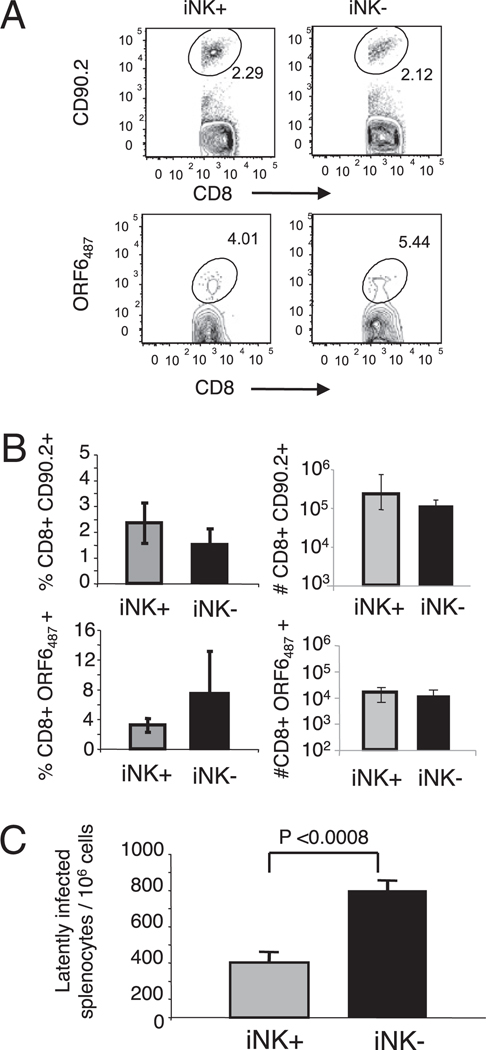
FIGURE 5.
KLRG1+NKG2A+ expression on CD8 T cells correlates with protective efficacy during a recall response to γHV68. KLRG1+NKG2A+ and KLRG1−NKG2A− CD8 T cells were FACS purified from the spleens of mice 3 mo after γHV68 infection, adoptively transferred into naive congenic animals, and the mice were infected with γHV68 24 h later. The analysis was performed using the spleens of recipient mice on day 16 p.i. A, Representative plots show the frequency of CD90.2+ cells among the CD8+ T cell population (top panels) and the frequency of γHV68 ORF6487–495/Db-specific cells among the CD90.2+ CD8+ T cell population (bottom panels). The left panels show the KLRG1+NKG2A+ adoptive transfer group (iNK+), and the right panels shows the KLRG1−NKG2A− adoptive transfer group (iNK−). Numbers represent the percentage of cells in each gate. B, Bar diagrams show the frequency (left panels) and cell numbers (right panels) of donor CD90.2+ CD8+ T cells (top panels) and those of γHV68 ORF6487–495/Db-specific cells among the donor CD90.2+ CD8+ population (bottom panels). C, Bar diagram displays the number of latently infected cells per 106 splenocytes. Data are the mean of three individual mice per experiment, and error bars represent SD. Similar results were obtained in three independent experiments.

