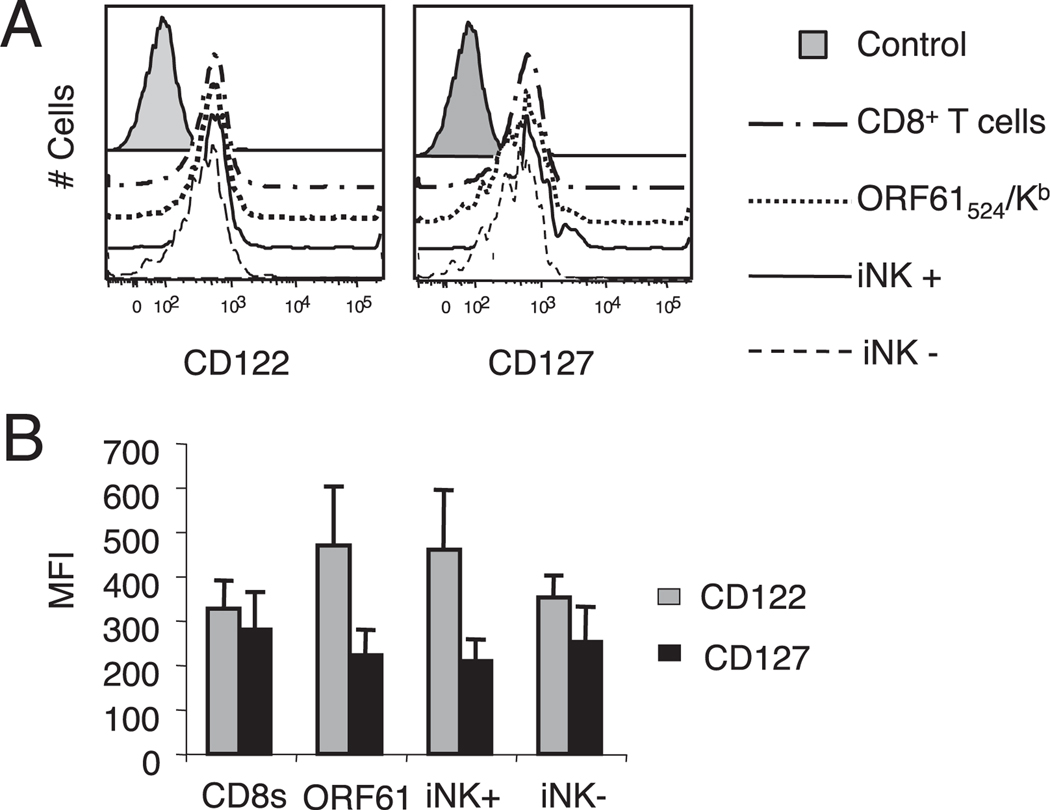
FIGURE 7.
γHV68-specific KLRG1+NKG2A+ CD8 T cells express homeostatic cytokine receptors. Splenocytes were isolated from mice infected with γHV68 for 3 mo. A, Representative histograms display the expression profile of CD122 (left panel) and CD127 (right panel) on CD8 T cells, γHV68 ORF61524–531/Kb-specific CD8 T cells, γHV68 ORF61524–531/Kb-specific KLRG1+NKG2A+ CD8 T cells (iNK+), and γHV68 ORF61524–531/Kb-specific KLRG1−NKG2A− CD8 T cells (iNK−). B, Bar diagram shows the mean fluorescence intensity (MFI) of CD122 and CD127 within the groups described above. Data are the mean of three individual mice per experiment, and error bars represent SD.

