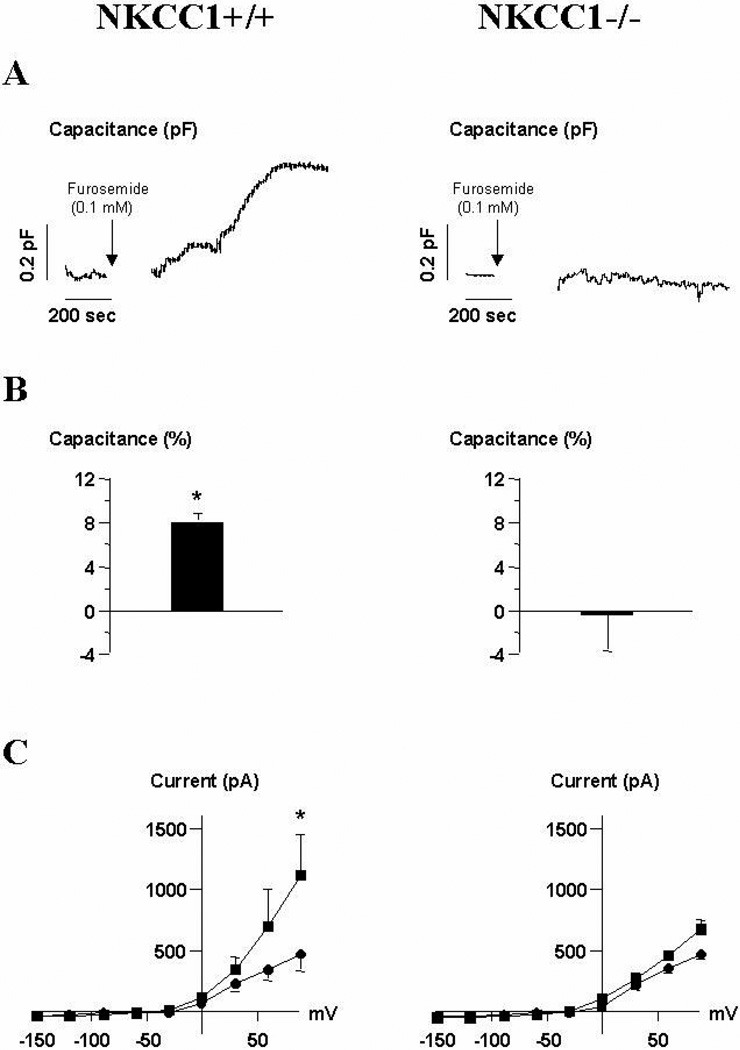
Fig. 5.
A: Original recording of membrane capacitance in a single mouse juxtaglomerular cell from NKCC1+/+ (left) and NKCC1−/− mice (right). The pipette contained control internal solution and the cell was bathed in control external solution supplemented with furosemide (10−4M) at the time indicated by the arrow (see method section). B: Mean relative change of Cm for JG cells from NKCC1+/+ (left) and NKCC1−/− mice (right). C: Whole-cell currents were measured in response to 9 pulses from −150 mV to +90 mV in 30 mV steps for 200 ms from a holding potential of −30 mV. These pulses were applied before and after superfusion with furosemide (10−4M). Mean steady-state I-V curves from 5 independent experiments before (circle) and after (square) 20 minutes of capacitance measurements are given. * p<.05 vs. control.

