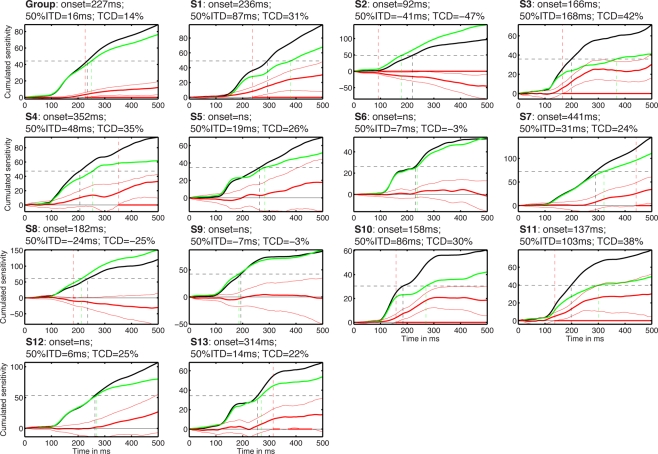
Figure 10.
Cumulated task effects. The subject number is indicated by S#. Each cell shows the cumulated normalized sensitivity in the identity task (black) and in the color task (green). The difference between the two tasks is shown with thick red lines, with a 95% confidence interval around it (thin red lines). Red dots along the zero horizontal line mark time points of significant task differences, with no correction for multiple comparisons. The vertical red dashed line that crosses the entire cell marks the onset of significant task effects. The horizontal black dashed line marks the value corresponding to 50% of the total cumulated sensitivity in the identity task. The two vertical lines that originate from the 50% line and terminate on the x-axis mark the time to reach that 50% value in the two tasks. The title of each cell contains the onset of the task effects; the 50% integration time difference (50% ITD) between the color and the identity tasks; the task cumulated difference (TCD) between the identity and the color tasks, expressed in proportion of the maximum cumulated sensitivity in the identity task.

