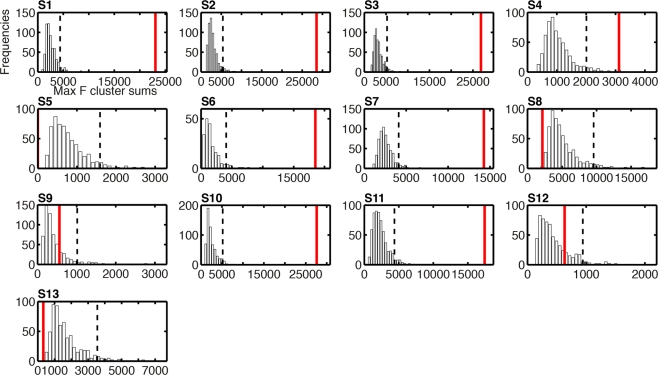
Figure 11.
Histograms of the bootstrap distributions of maximum F cluster sums for task effects on single-trial ERP noise sensitivity. The subject number is indicated by S# in bold font. These bootstrap distributions were calculated under the null-hypothesis H0, as described in Methods; hence they reflect the size of spatial–temporal task effects that can be expected by chance, due to random sampling, across the entire search space. For each subject, the vertical black dashed line marks the 95th percentile of the H0 bootstrap distribution. The vertical red continuous line indicates the maximum sum of F values across the spatial–temporal clusters that contained the maximum R2 electrode. For subject S5, the cluster sum is equal to zero because no cluster passed the two-electrode threshold: they were present at this electrode only.

