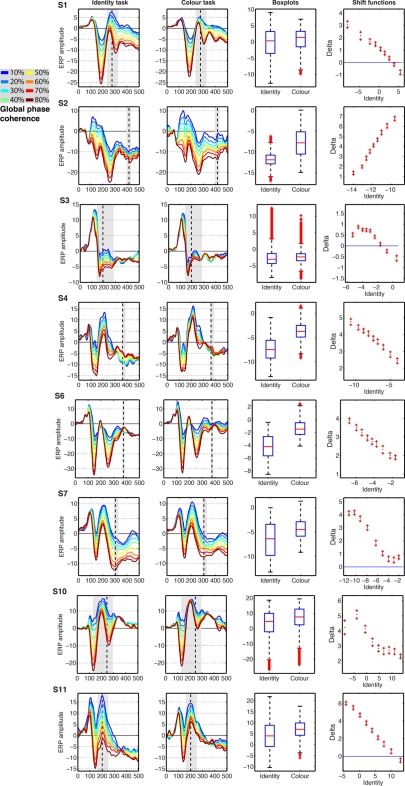
Figure 12.
Event-related potentials results from the eight subjects showing significant task effects. The subject number is indicated by S# in bold font. The first two columns show the modeled ERPs in the identity and the color tasks. The vertical dashed line marks the latency of the largest task difference. The vertical gray shaded area marks all the continuous time frames at which a significant effect was observed, and which contained the time frame of maximum effect. The third column shows boxplots of the single-trial modeled ERP(t,e) amplitudes in the identity and color tasks, summed across the time frames marked by gray areas in columns 1 and 2. The fourth column shows the shift function between the distributions in column three. The x-axis shows the estimated deciles in the identity task. The y-axis shows the estimated difference deciles between the identity and the color task, marked as nine dots, with the ends of the confidence intervals marked by plus signs.

